#TravelWithCANIE and Reduce Emissions to the Forum on Education Abroad 2022!

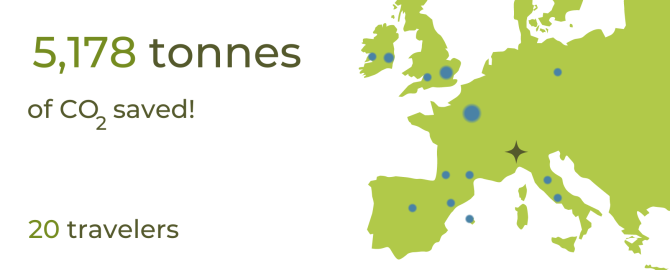
5,178 tonnes saved!
What does 20 tonnes of CO2 mean?
According to the U.S. Environmental Protection Agency, 20 tonnes of CO2 is equivalent to...
- Energy for 2,5 homes for 1 year
- 49.644 km driven by an average car
- Nearly 2,5 million smartphones charged
- 46,3 barrels of oil consumed
- 8.517 liters of gas consumed
Together we can drive change and reduce the overall carbon impact of the Forum on Education Abroad in 2022. We encourage you to speak to your colleagues and engage in meaningful discussion around systemic changes on international education travel.
Prefer to have company on your journey? Visit the LinkedIn group to share your itinerary, ask questions, and get in touch with colleagues who you will overlap with. Here are some itineraries your colleagues have shared:
- Dublin -> London -> Paris -> Milan
- Mallorca -> Barcelona -> Milan
HOW TO:
- Calculate your would-be airline travel emissions
- Calculate your new, carbon-conscious travel emissions (by ground transport)
- Subtract your new emission from your would-be emissions and voila, your emissions savings total
For the purposes of the #travel with CANIE project, we use the emissions calculator at carbonfootprint.com.
*Please consider the values generated by this carbon calculator as estimates of the carbon emitted by various forms of travel. For the purposes of estimating carbon savings by switching your mode of travel to conferences, this calculator is considered sufficient. There are specific carbon calculators for each mode of travel that may be more detailed and robust, but for our current purposes, this calculator provides the convenience of all modes of transport in one place.*
We will share the total commitments as we receive them.
Please complete this Google Form to receive your #TravelWithCANIE certificate after the conference!
The Forum Incentive
Exciting news!
To those joining the initiative, The Forum on Education Abroad will offer a voucher for USD$100 off a future Forum event! Check out the Forum's page on Sustainable Travel for more information.
Traveler Testimonials
Impact Chart: Traveling to Milan by Train
| City | Distance (Km) | Hrs by Rail | Hrs by Plane | kg CO2 per Person by rail - one way* | kg CO2 per person by plane - one way% |
| Amsterdam | 1079 | 16 | 2h00 | 5 | 209 |
| Athens | 1723 | 32 | 2h25 | N/A | 302 |
| Berlin | 1038 | 15 | 1h40 | 6 | 173 |
| Brussels | 909 | 13.5 | 1h30 | 5 | 236 |
| Copenhagen | 1438 | 19.5 | 2h05 | 8 | 267 |
| Dublin | 1926 | 27 | 2h35 | 43 (incl. ferry) | 338 |
| Glasgow | 1995 | 23 | 4h30 | 29 | 354 |
| London | 1320 | 17 | 1h50 | 6 | 223 |
| Madrid | 1583 | 19 | 2h20 | 8 | 244 |
| Oslo | 1925 | 27 | 2h20 | N/A | 430 |
| Paris | 864 | 7h33 | 1h25 | 5 | 140 |
| Prague | 870 | 13 | 1h25 | 7 | 155 |
| Rome | 569 | 3h30 | 1h10 | 3 | 137 |
| Stockholm | 2079 | 24 | 2h40 | N/A | 392 |
| Vienna | 837 | 10 | 1h20 | 4 | 176 |
*using Rail Europe’s carbon calculator
% using Atmosfair’s flight carbon calculator